Local Eclipse Info For the NWS Wilmington, Ohio Area
Countdown Until Solar Eclipse Begins in Wilmington, Ohio
|
|
|
|
|
|
Days |
Hours |
Minutes |
Seconds |
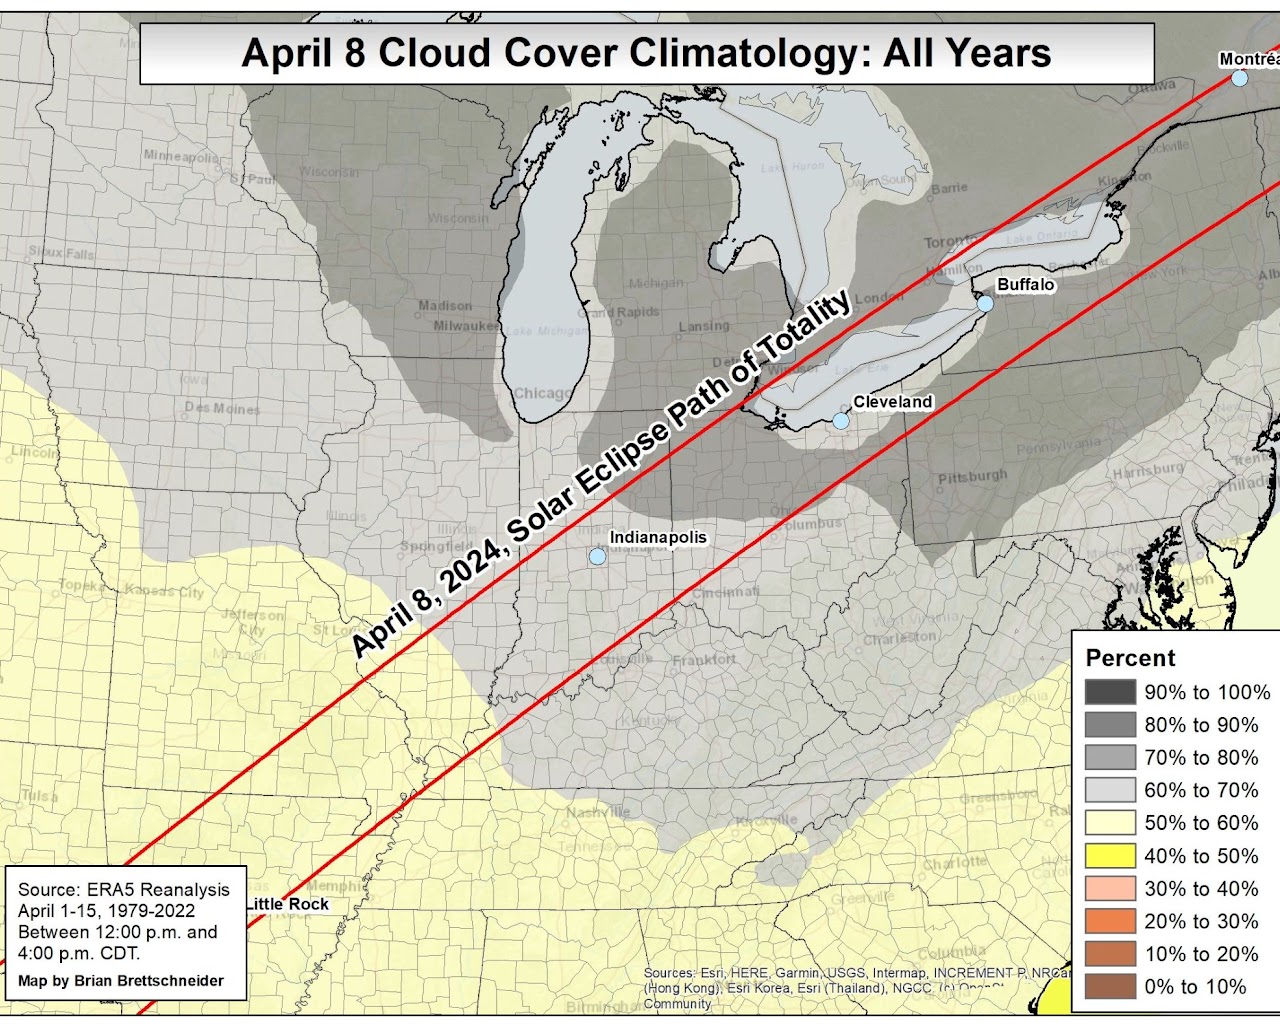
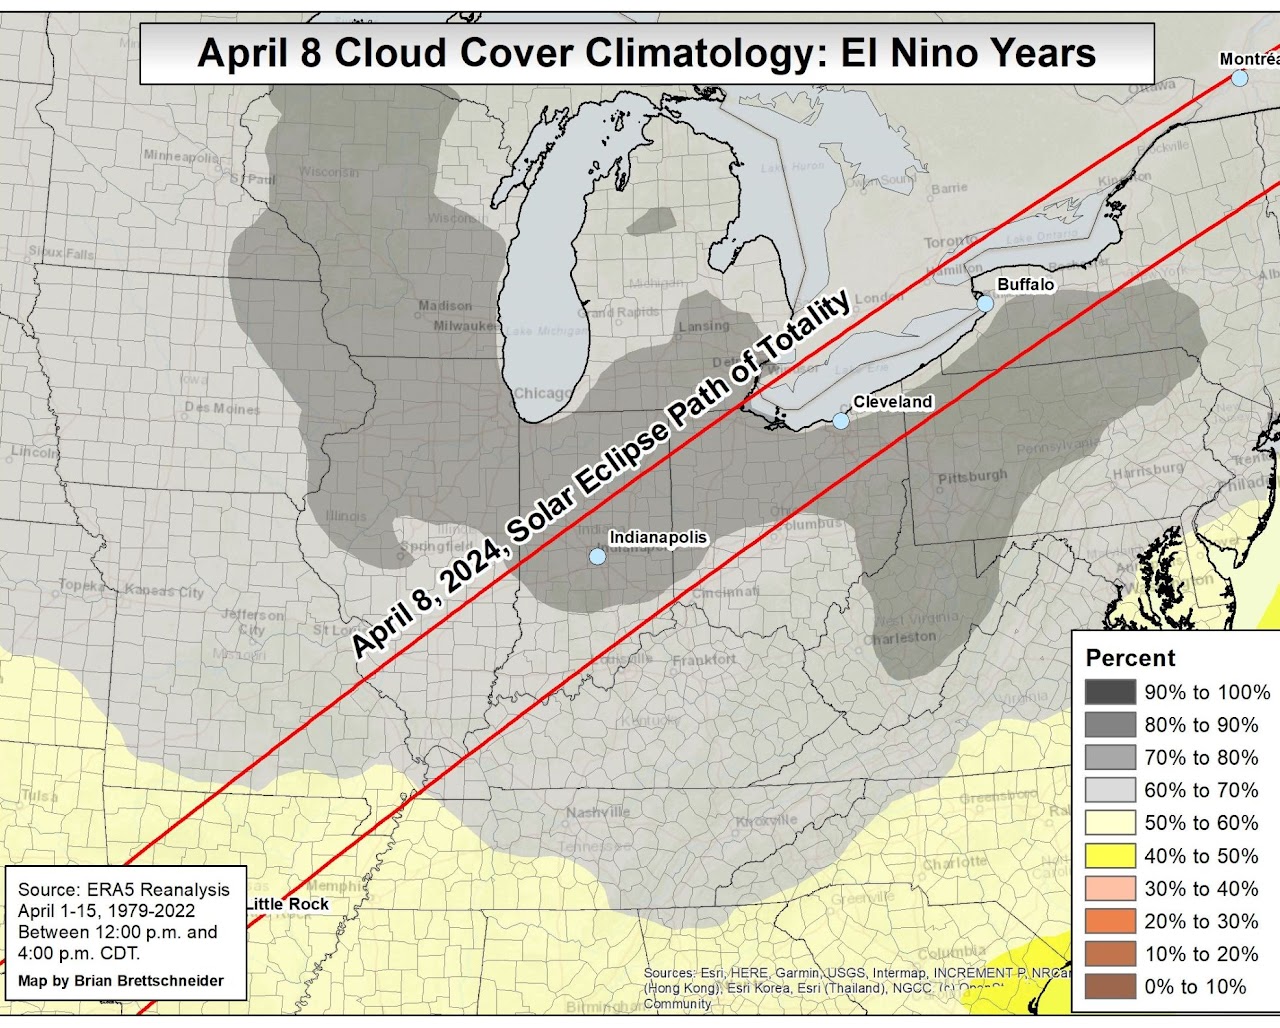
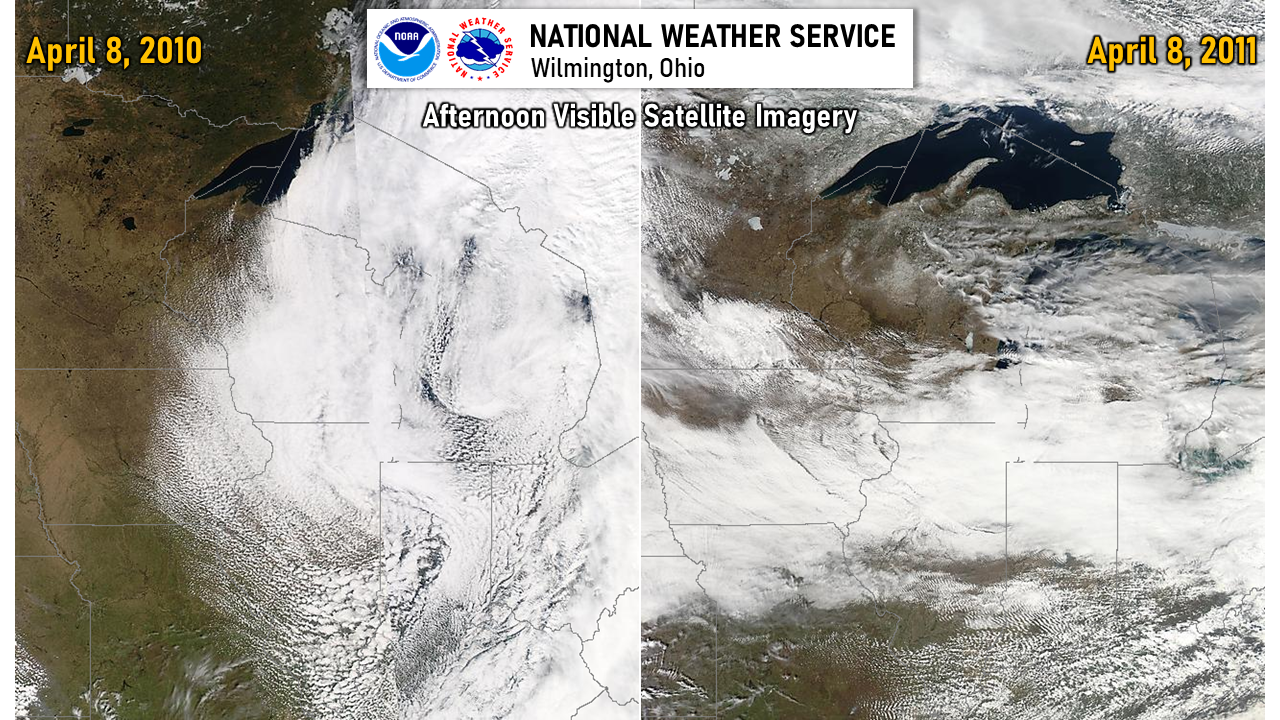
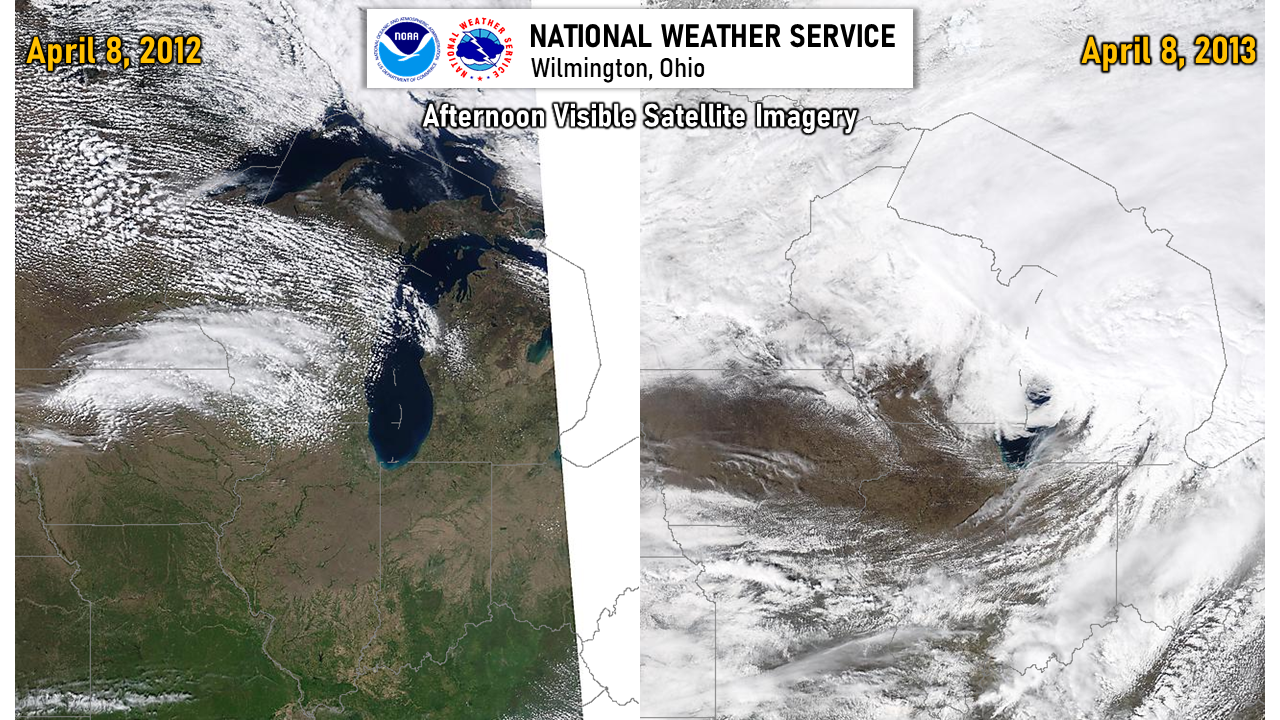
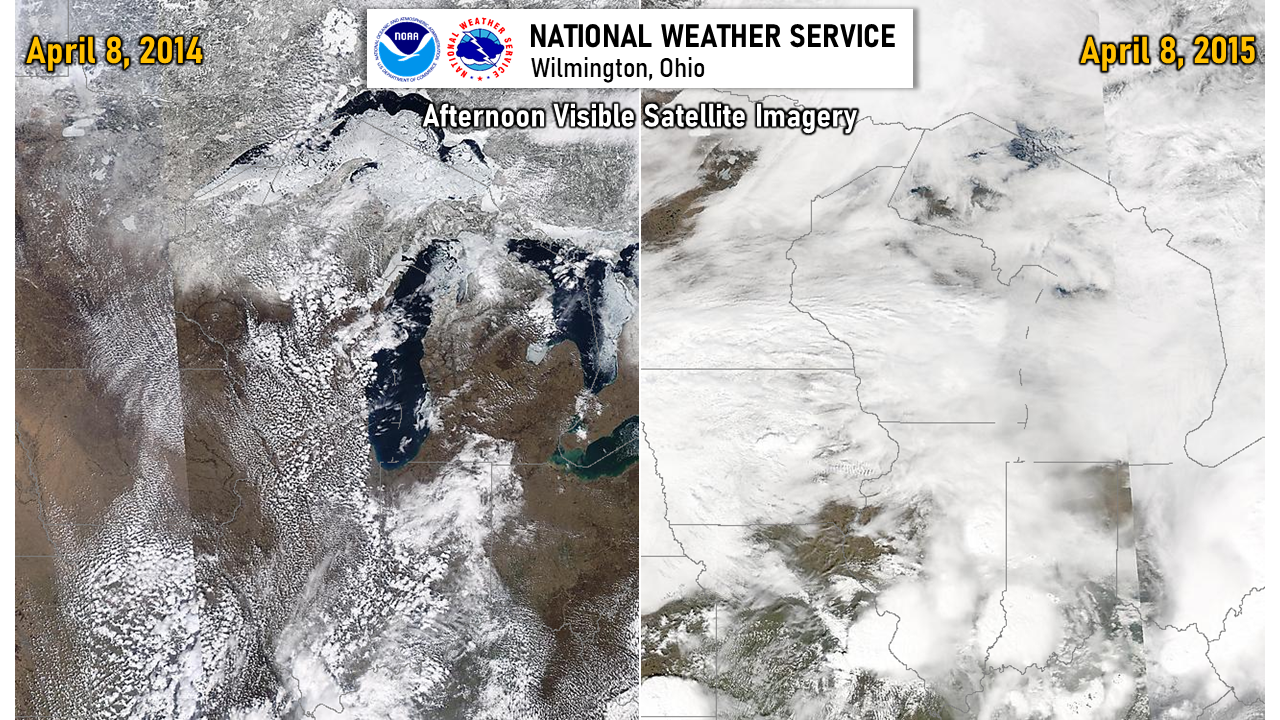
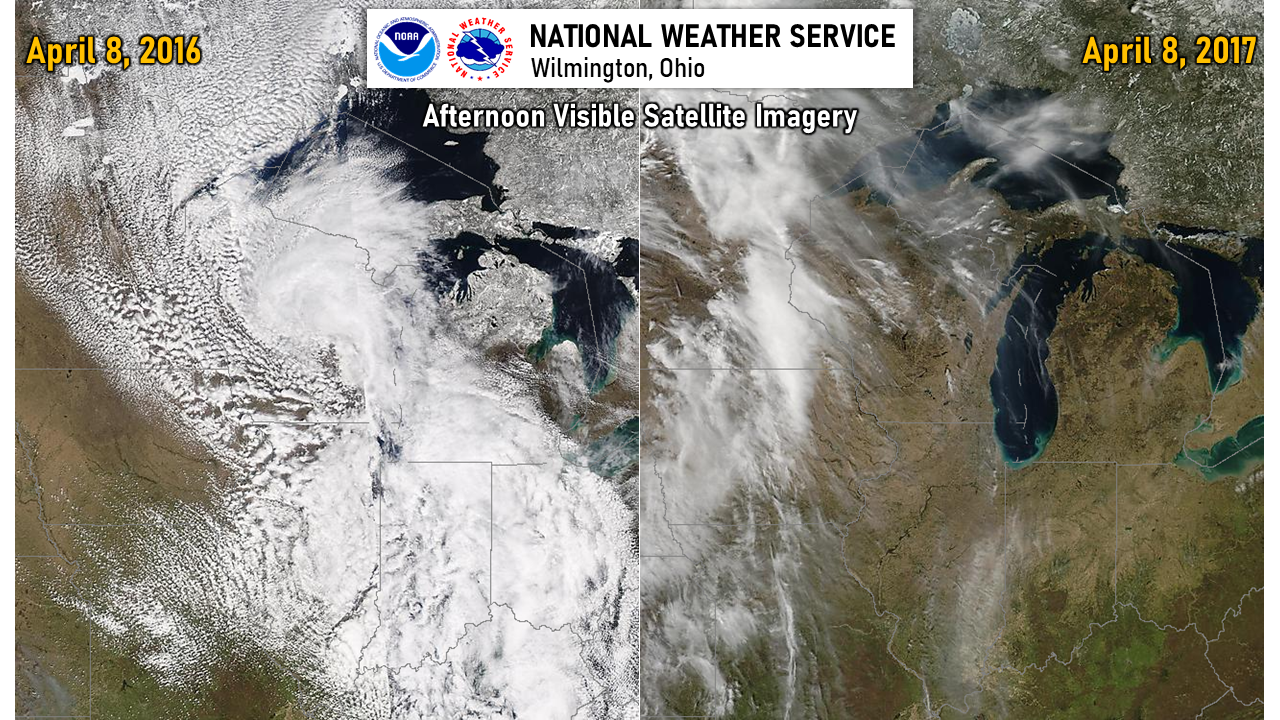
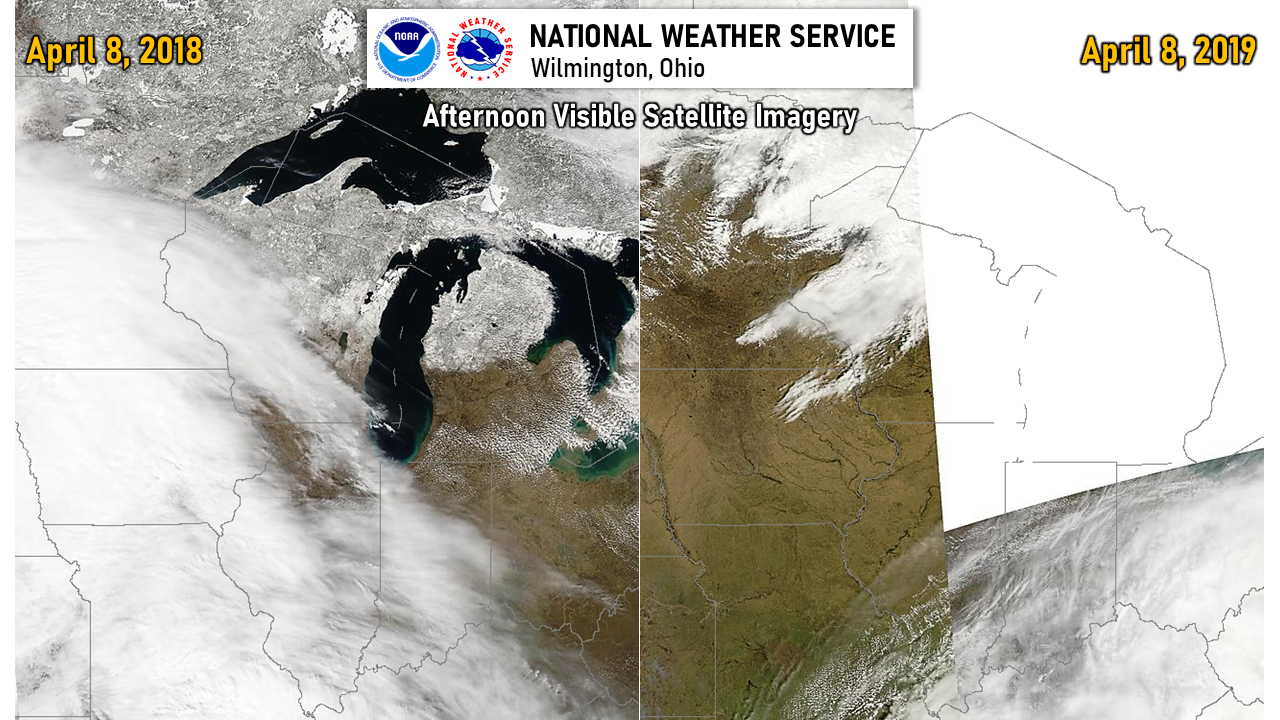
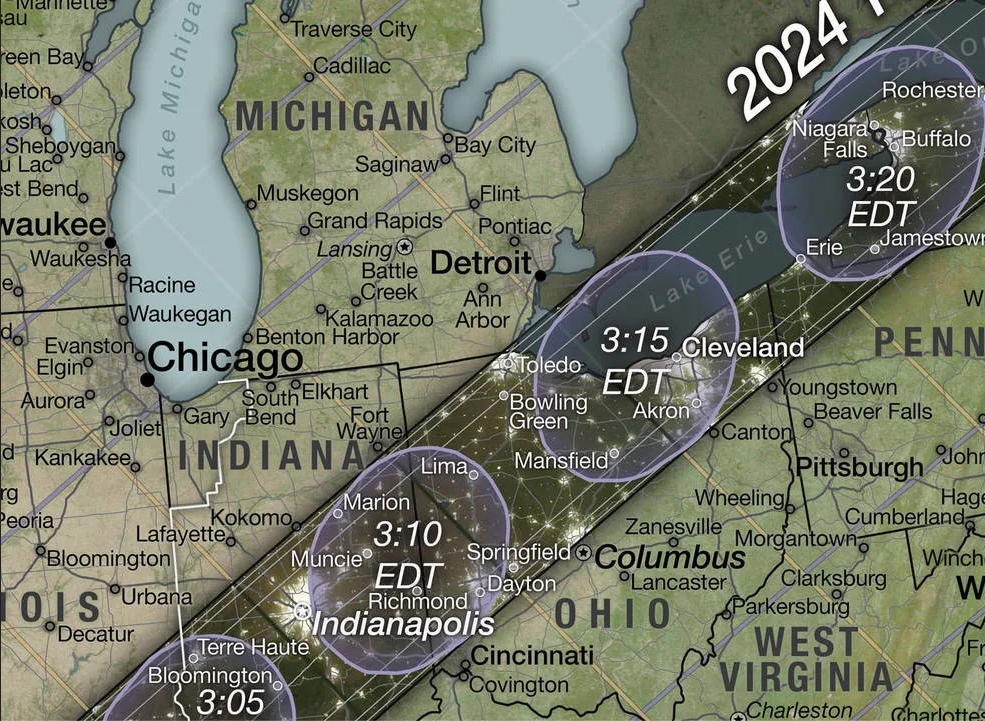
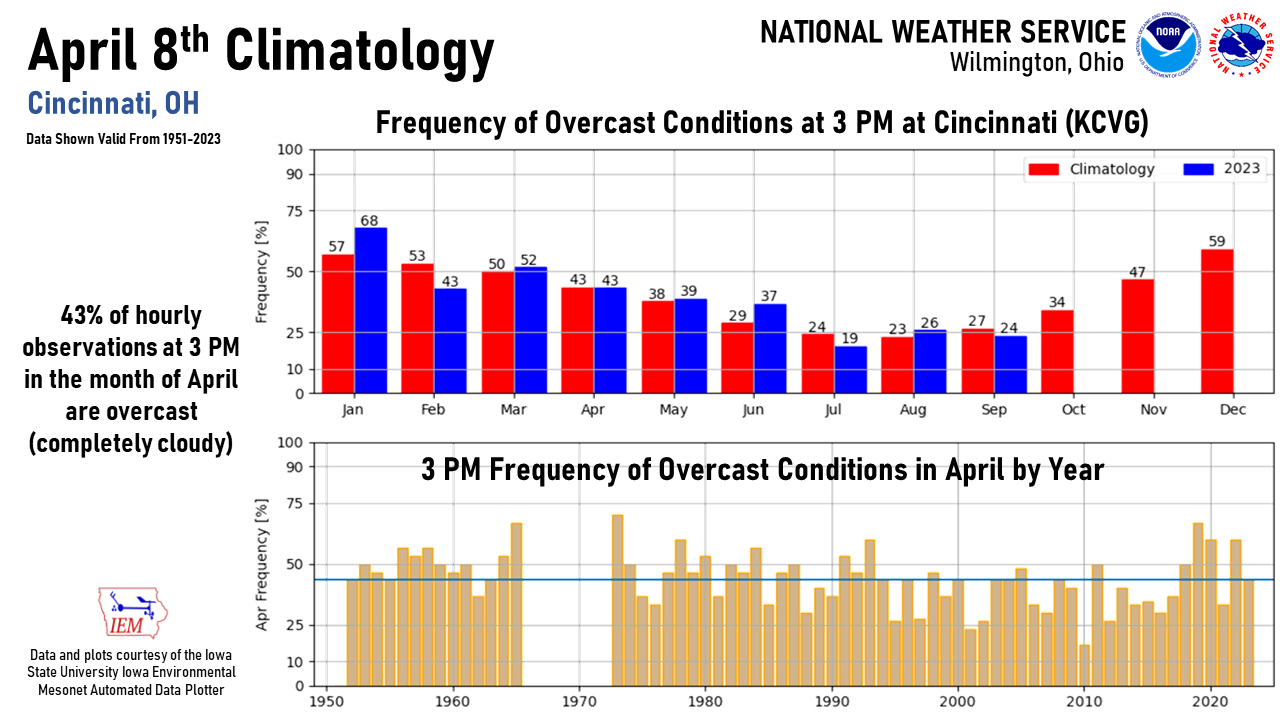
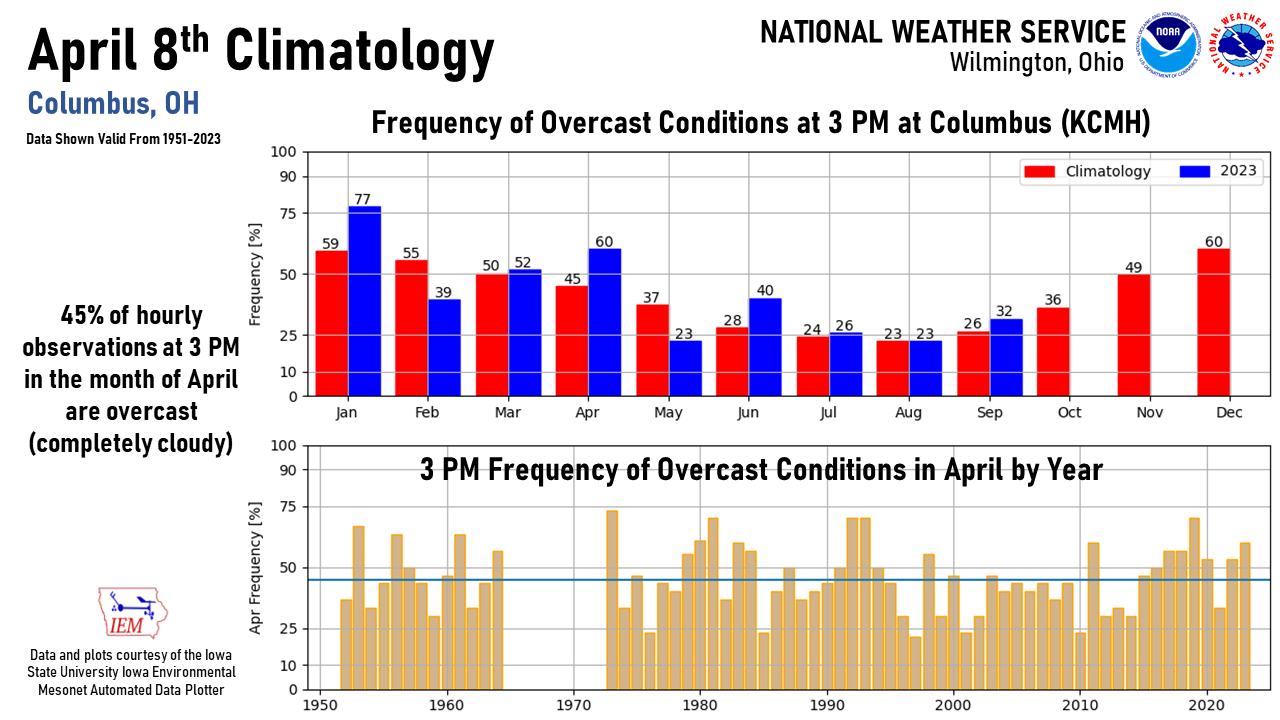
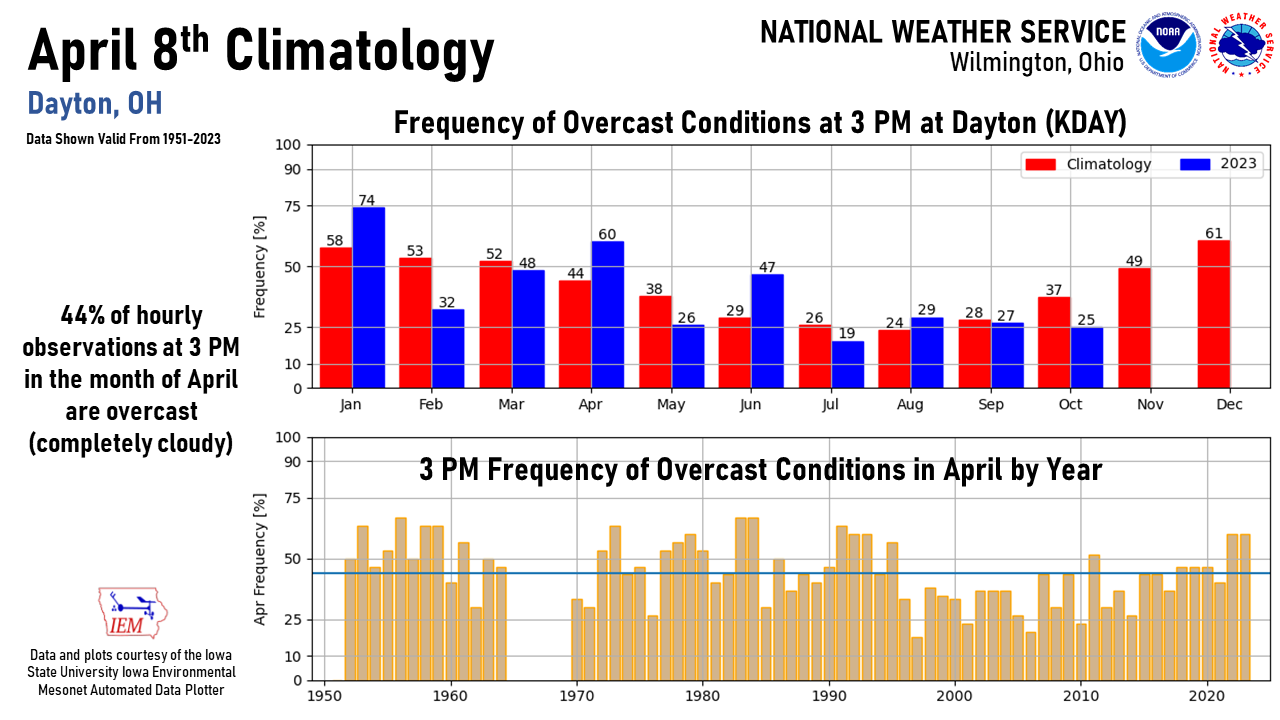
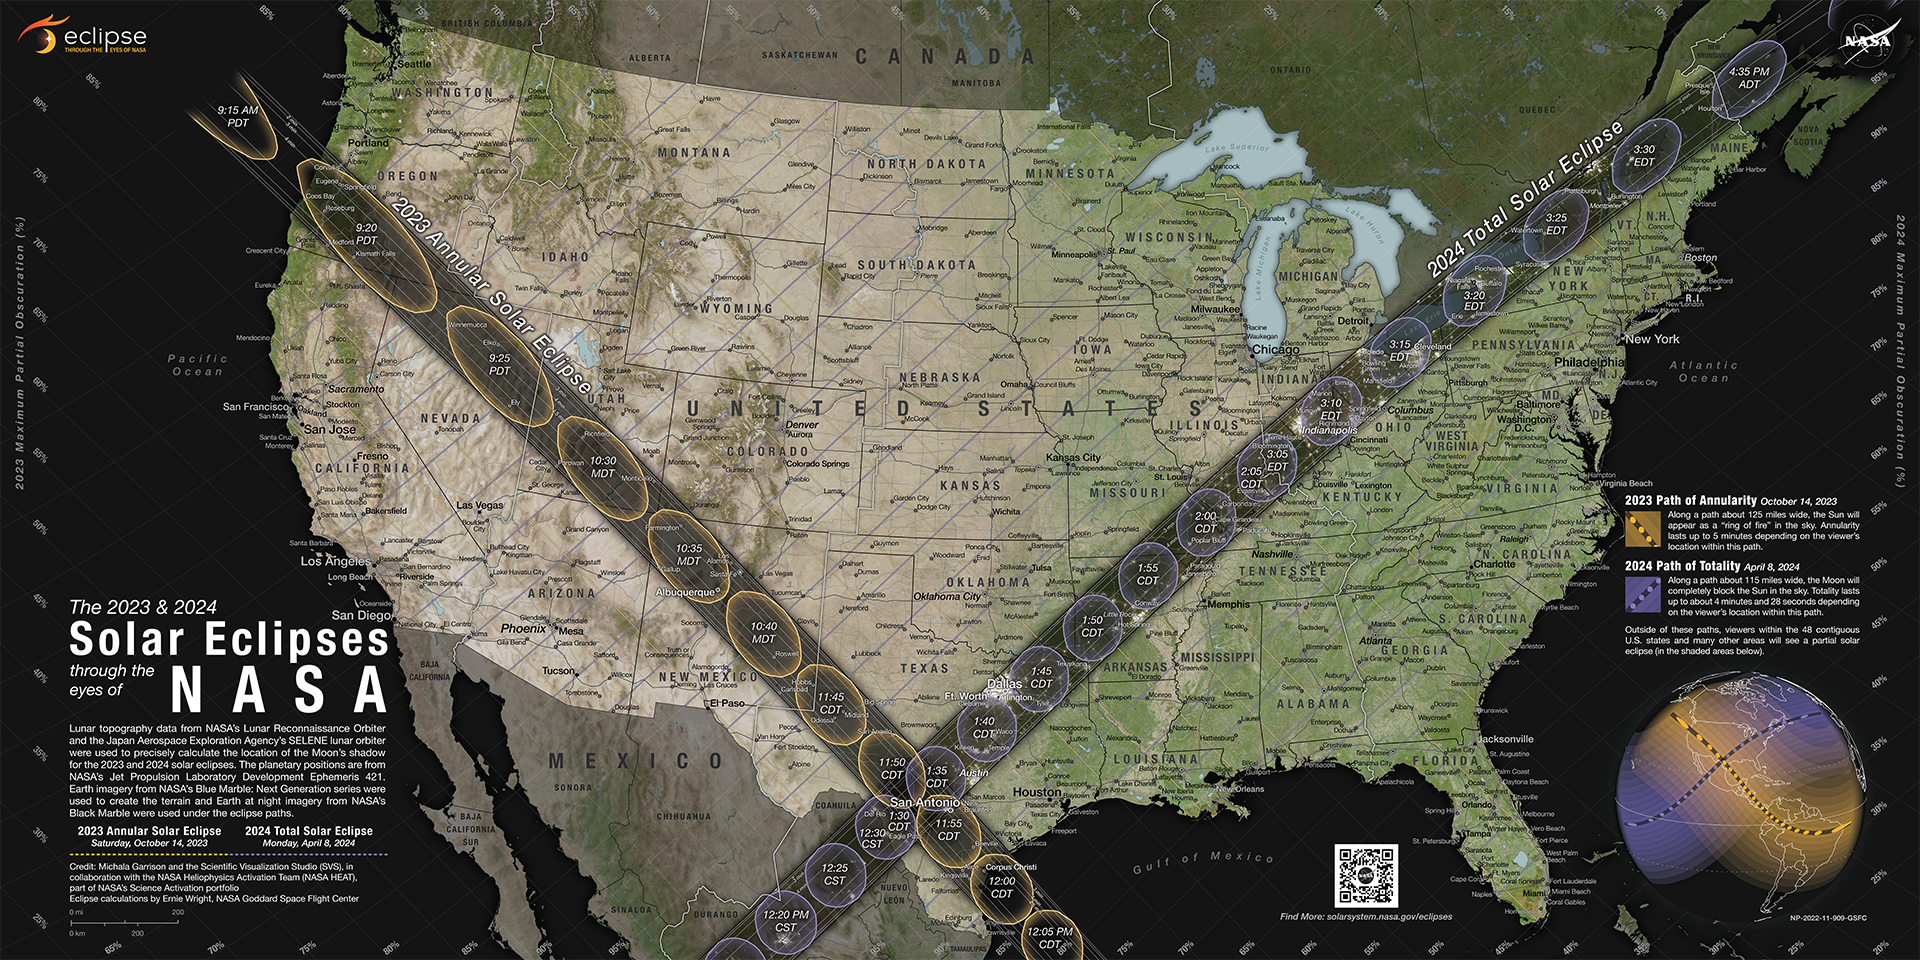
2024 Eclipse Viewability Interactive Map Here is cloud cover climatology for the afternoon hours on April 8th. The image on the top shows the average of all years, while the image on the bottom shows only El Nino Years. The current forecast suggests El Nino conditions will be present this winter and may linger into next Spring. This typically leads to a bit more cloud cover across our region in April. Map plots courtesy of Brian Brettschneider, NOAA. Below are visible satellite images from the afternoon of April 8ths in the past decade or so. As you can see, there is a wide variety of cloud coverage patterns over the Ohio Valley from year-to-year. Click on images to enlarge. Eclipse Path Information The eclipse path will stretch from Mexico to Canada, straight through the Ohio Valley. Portions of southeast and east-central Indiana and west-central Ohio will be in the path of totality. Image courtesy of NASA. Cincinnati, OH (KCVG) Columbus, OH (KCMH) Dayton, OH (KDAY) Additional Eclipse 2024 Information Video Courtesy of the National Aeronautics and Space Administration (NASA) Using observations from different NASA missions, this map shows where the Moon’s shadow will cross the U.S. during the 2023 annular solar eclipse and 2024 total solar eclipse. The map was developed by NASA's Scientific Visualization Studio (SVS) in collaboration with the NASA Heliophysics Activation Team (NASA HEAT), part of NASA’s Science Activation portfolio. After the total solar eclipse on April 8, 2024, the next total solar eclipse that can be seen from the contiguous United States will be on Aug. 23, 2044.
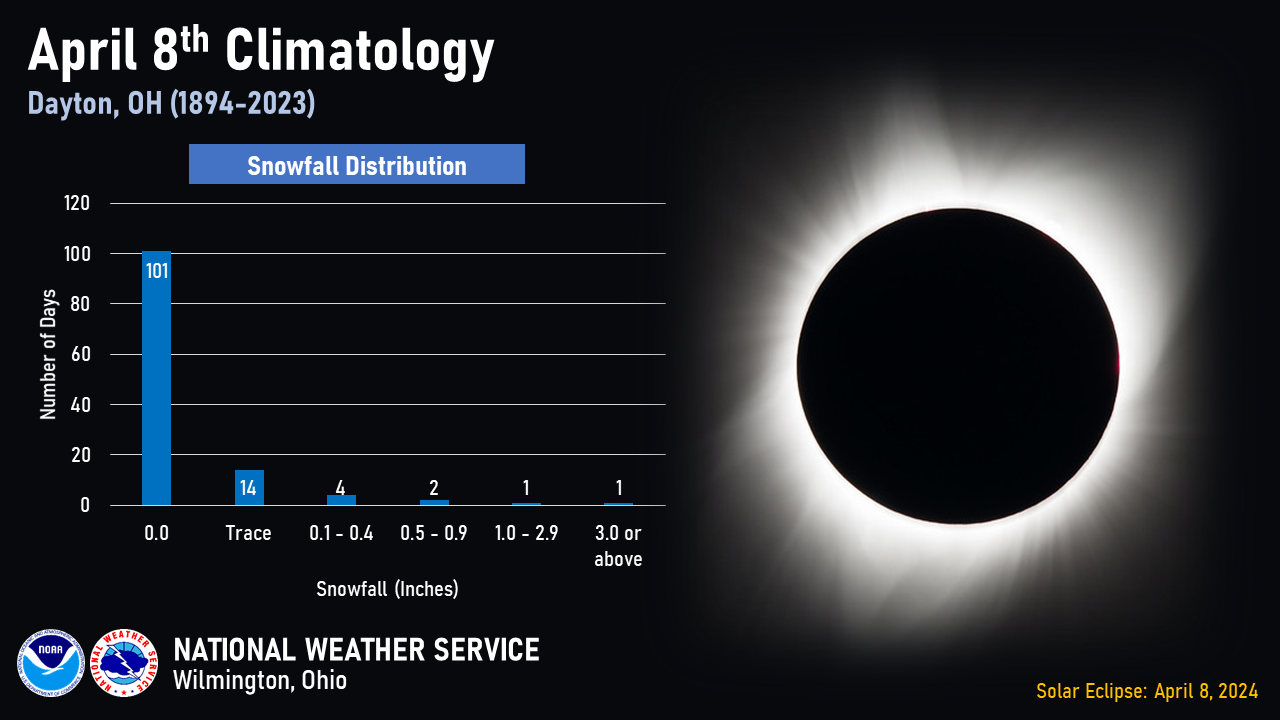
We can’t normally see the corona – the Sun’s outer atmosphere – because the Sun’s surface below it is so much brighter. But during a total solar eclipse, the corona becomes visible, offering unique opportunities to study it.
When the Moon completely blocks the visible surface of the Sun during a total solar eclipse, viewers can remove their eclipse glasses. A total solar eclipse is the only type of solar eclipse where eclipse glasses can be momentarily removed.
When a solar eclipse reaches totality, nocturnal wildlife sometimes wakes up, thinking that it’s nighttime, and non-nocturnal wildlife might think it’s time to head to sleep!

Location
Partial Begins
Maximum Totality
Totality Magnitude
Partial Ends
Eclipse Duration
Totality Duration
Ada, OH
1:55 PM EDT
3:12 PM EDT
102.4%
4:26 PM EDT
2hr, 31min
3min, 56sec
Bellefontaine, OH
1:54 PM EDT
3:11 PM EDT
101.8%
4:26 PM EDT
2hr, 31min
3min, 44sec
Celina, OH
1:53 PM EDT
3:10 PM EDT
102.0%
4:25 PM EDT
2hr, 31min
3min, 50sec
Chillicothe, OH
1:54 PM EDT
Not in Totality
97.9%
4:26 PM EDT
2hr, 32min
Not in Totality
Cincinnati, OH
1:52 PM EDT
Not in Totality
99.4%
4:24 PM EDT
2hr, 33min
Not in Totality
Columbus, OH
1:55 PM EDT
Not in Totality
99.6%
4:27 PM EDT
2hr, 31min
Not in Totality
Dayton, OH
1:53 PM EDT
3:10 PM EDT
100.7%
4:25 PM EDT
2hr, 32min
2min, 43sec
Delaware, OH
1:55 PM EDT
3:12 PM EDT
100.7%
4:27 PM EDT
2hr, 31min
2min, 37sec
Falmouth, KY
1:51 PM EDT
Not in Totality
98.0%
4:24 PM EDT
2hr, 33min
Not in Totality
Hamilton, OH
1:52 PM EDT
3:09 PM EDT
100.3%
4:25 PM EDT
2hr, 33min
1min, 42sec
Independence, KY
1:51 PM EDT
Not in Totality
99.0%
4:24 PM EDT
2hr, 33min
Not in Totality
Osgood, IN
1:51 PM EDT
3:08 PM EDT
100.6%
4:24 PM EDT
2hr, 33min
2min, 30sec
Piqua, OH
1:53 PM EDT
3:11 PM EDT
101.9%
4:25 PM EDT
2hr, 32min
3min, 48sec
Richmond, IN
1:52 PM EDT
3:09 PM EDT
101.9%
4:24 PM EDT
2hr, 32min
3min, 50sec
Versailles, OH
1:53 PM EDT
3:10 PM EDT
102.4%
4:25 PM EDT
2hr, 32min
3min, 58sec
Vanceburg, KY
1:53 PM EDT
Not in Totality
96.3%
4:26 PM EDT
2hr, 33min
Not in Totality
Xenia, OH
1:53 PM EDT
3:11 PM EDT
100.2%
4:25 PM EDT
2hr, 32min
1min, 21sec
Wilmington, OH
1:53 PM EDT
Not in Totality
99.4%
4:25 PM EDT
2hr, 32min
Not in Totality
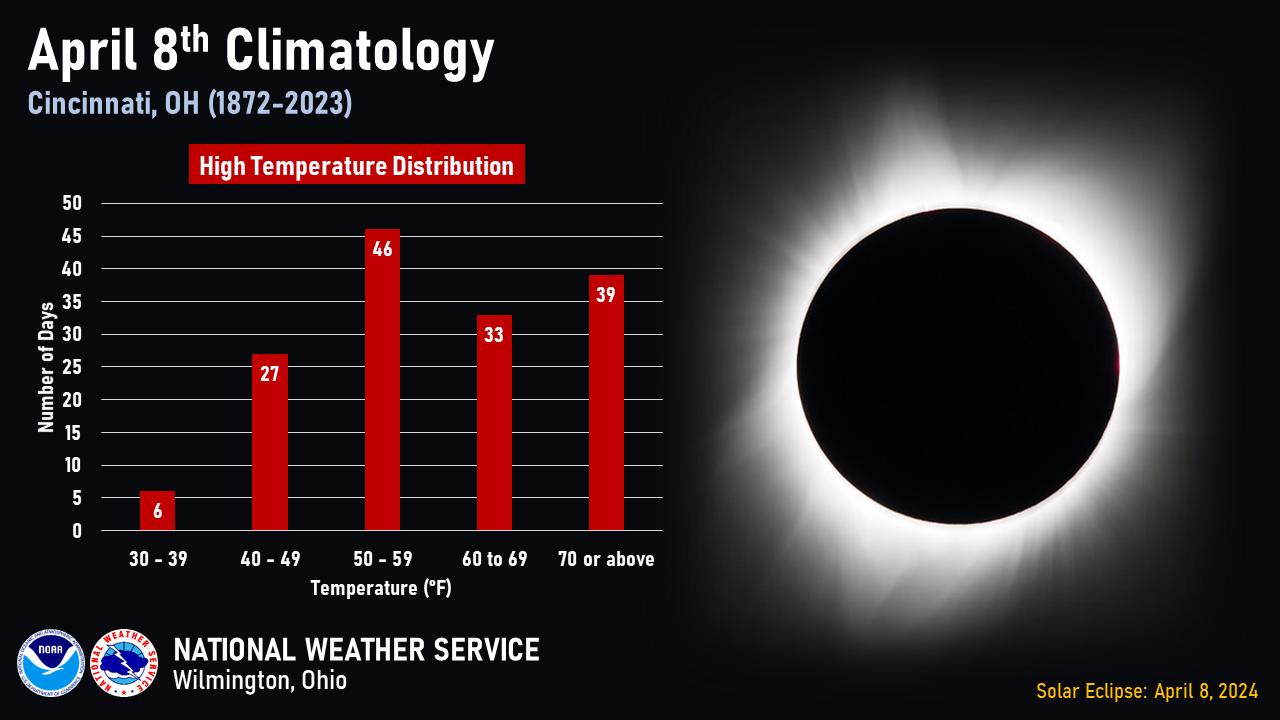
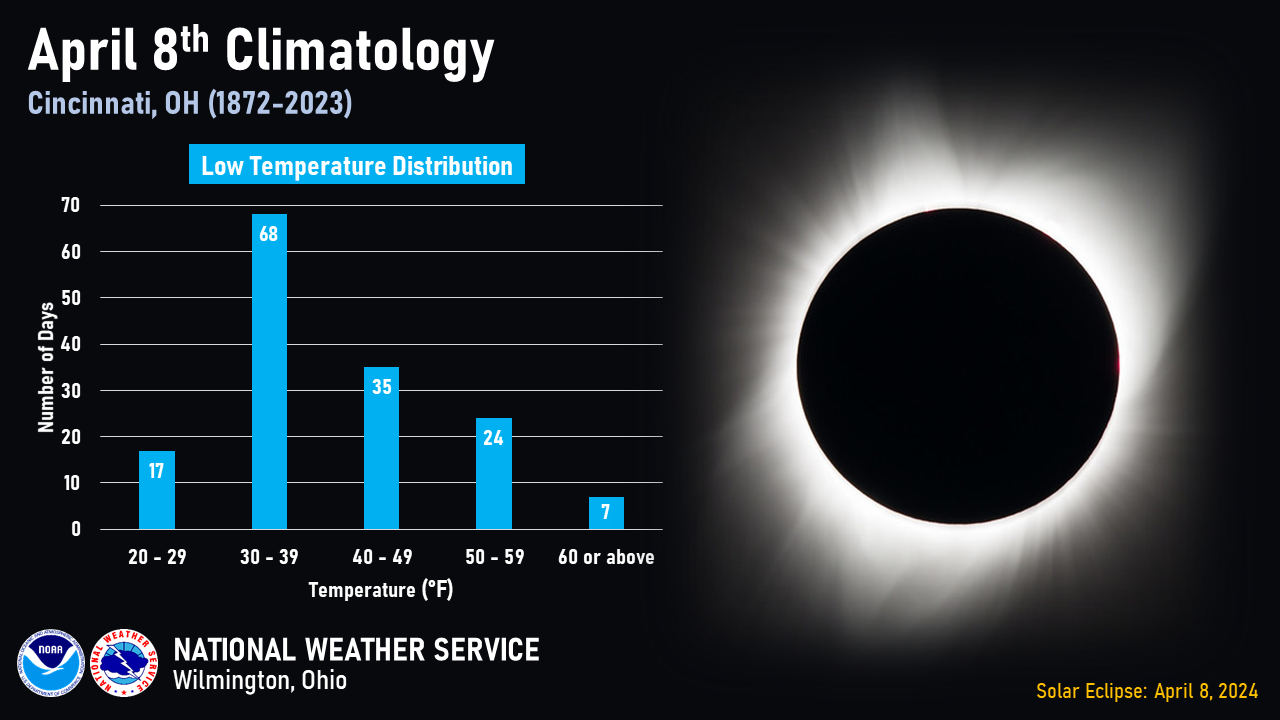
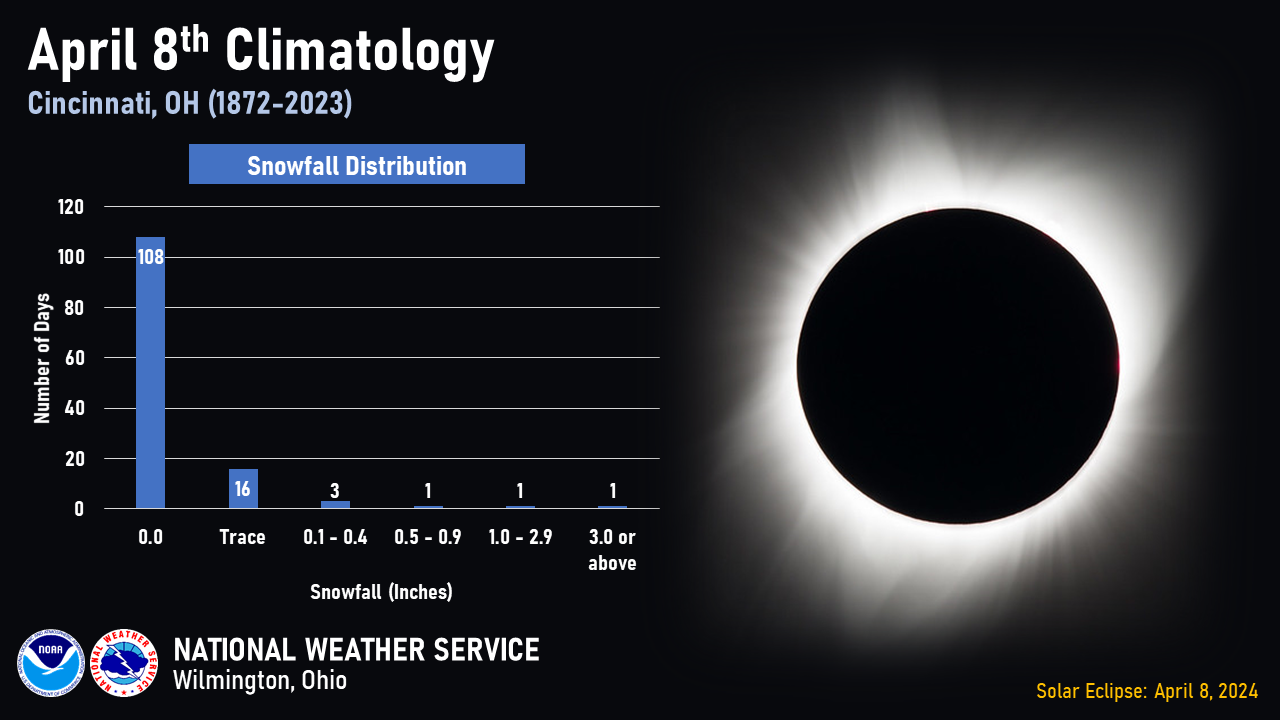
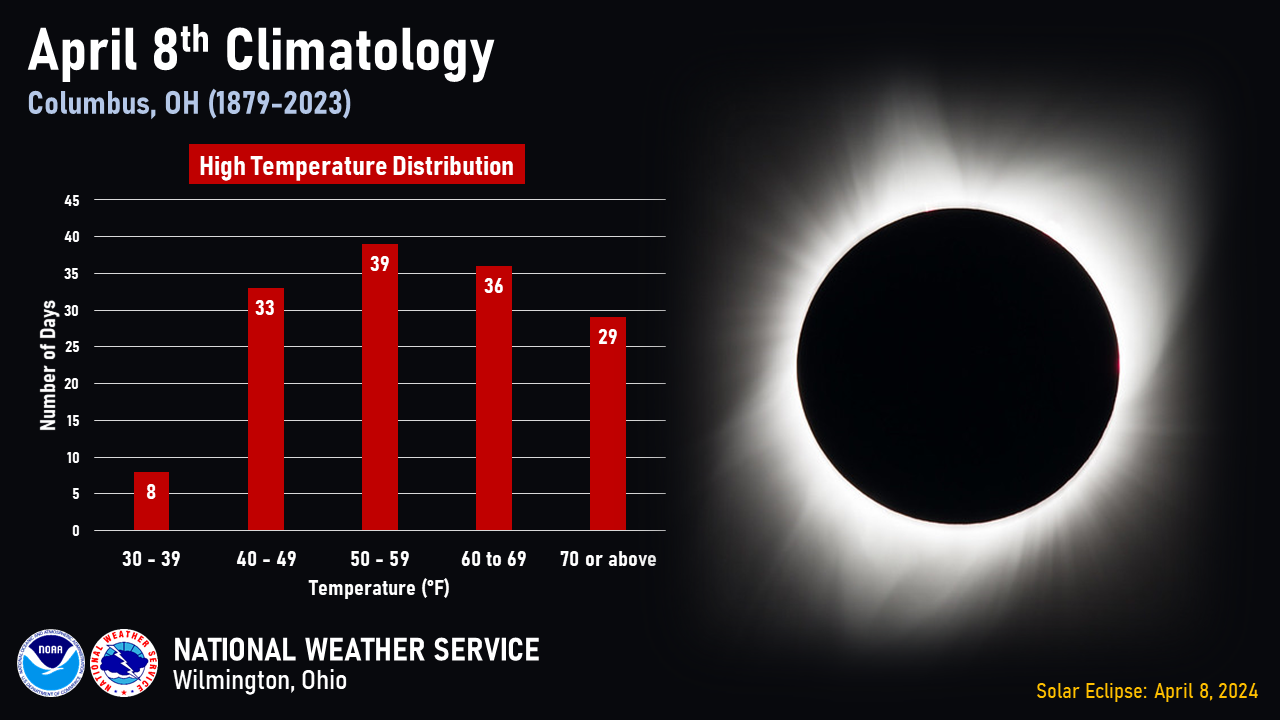
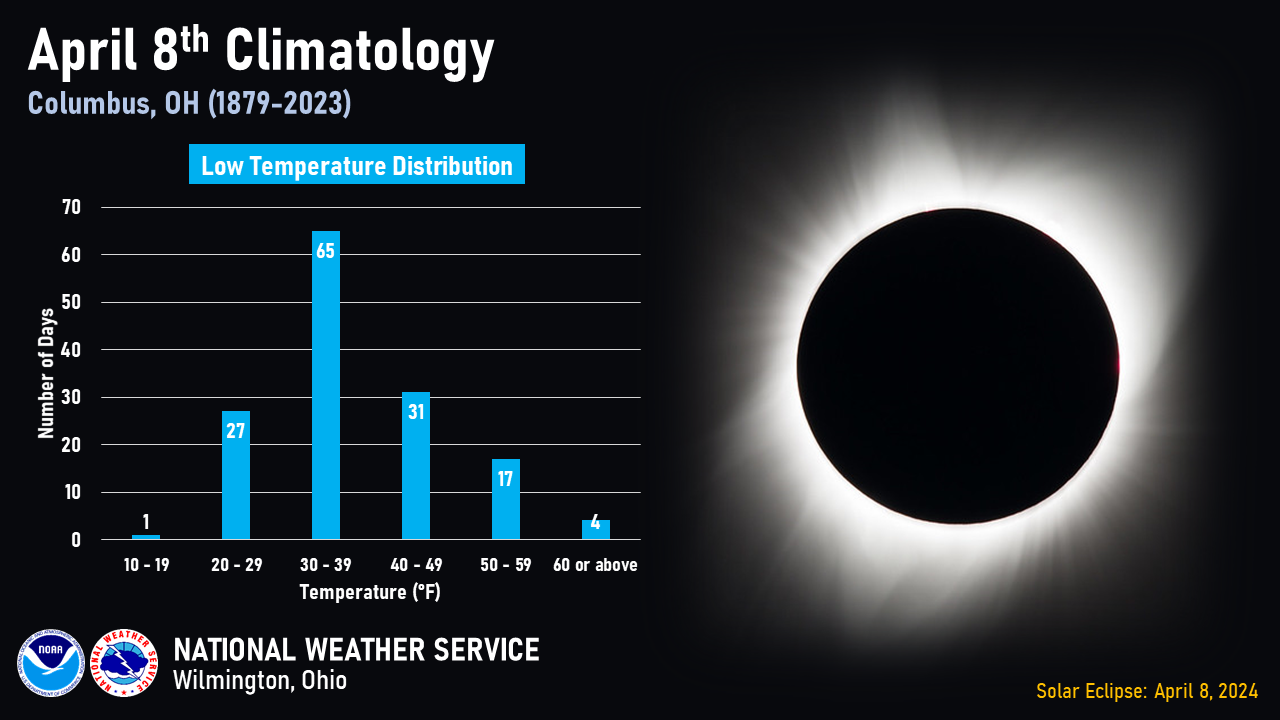
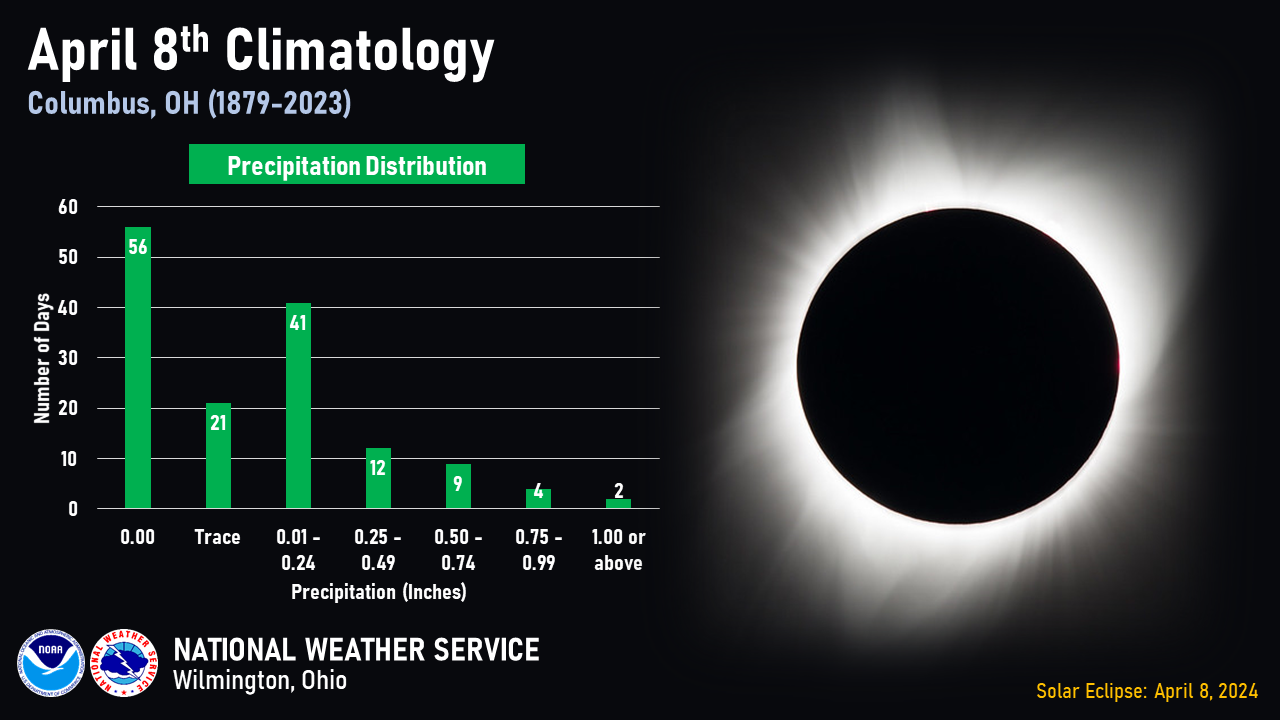
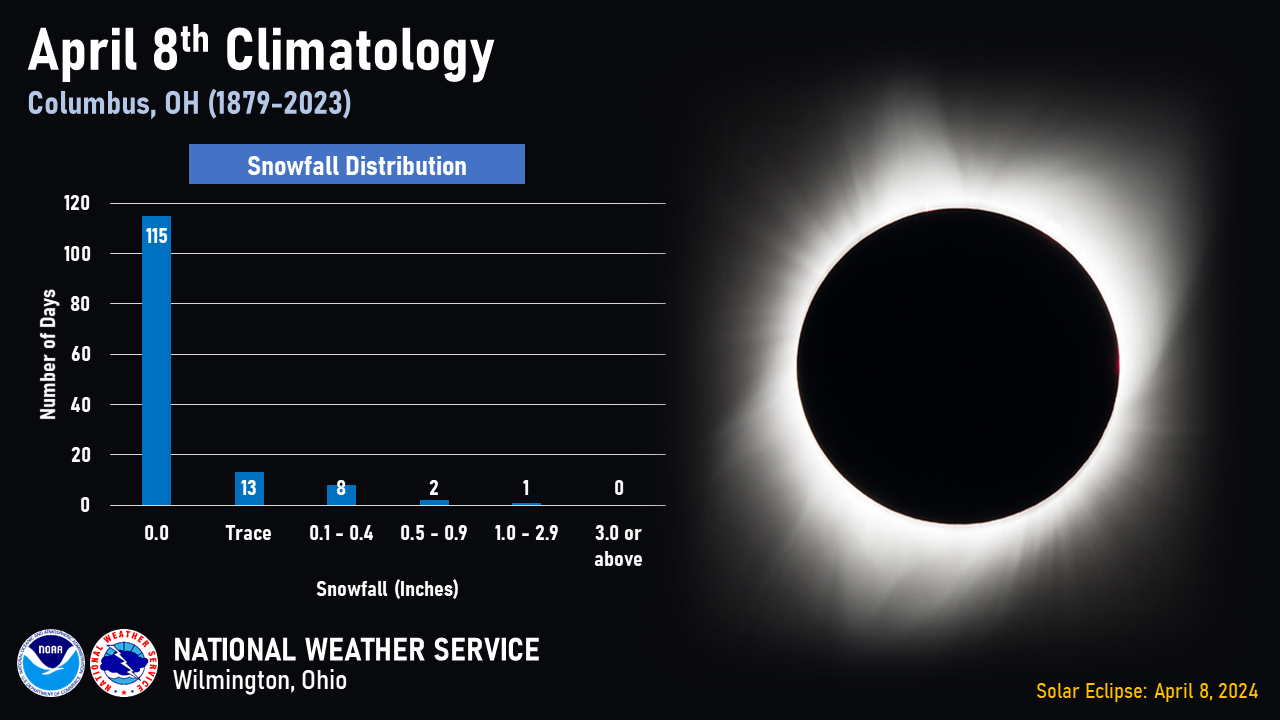
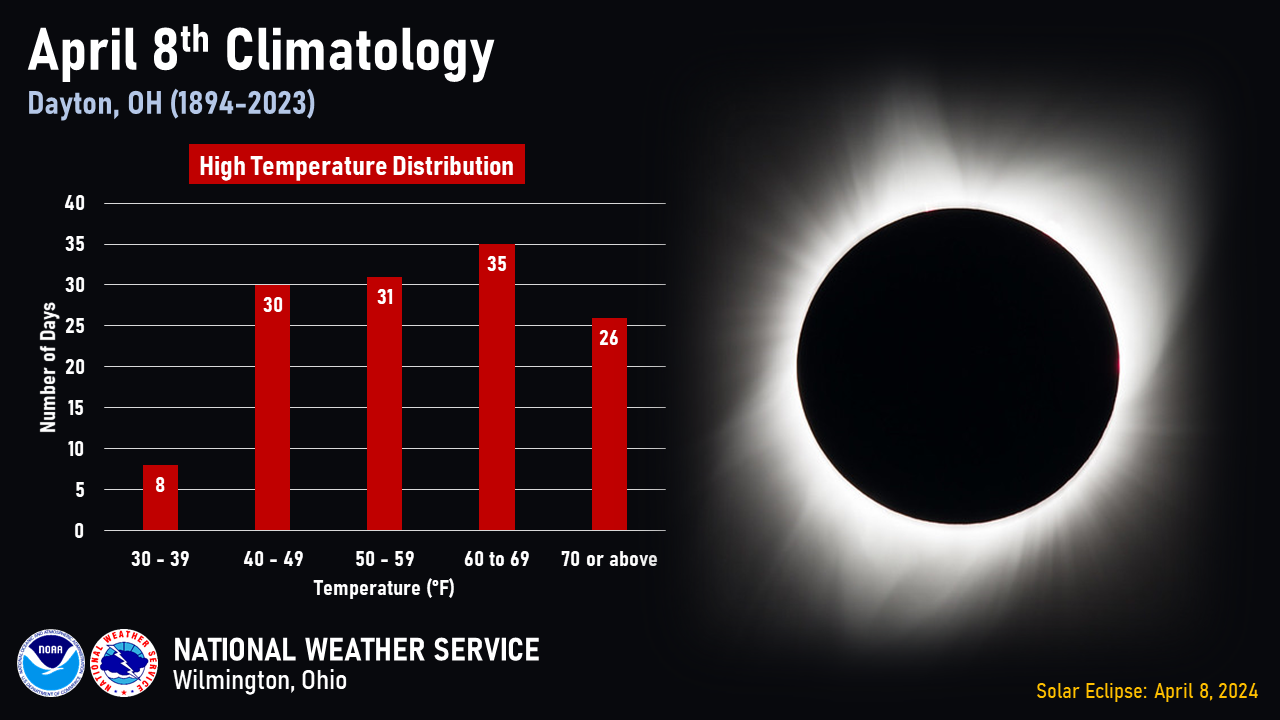
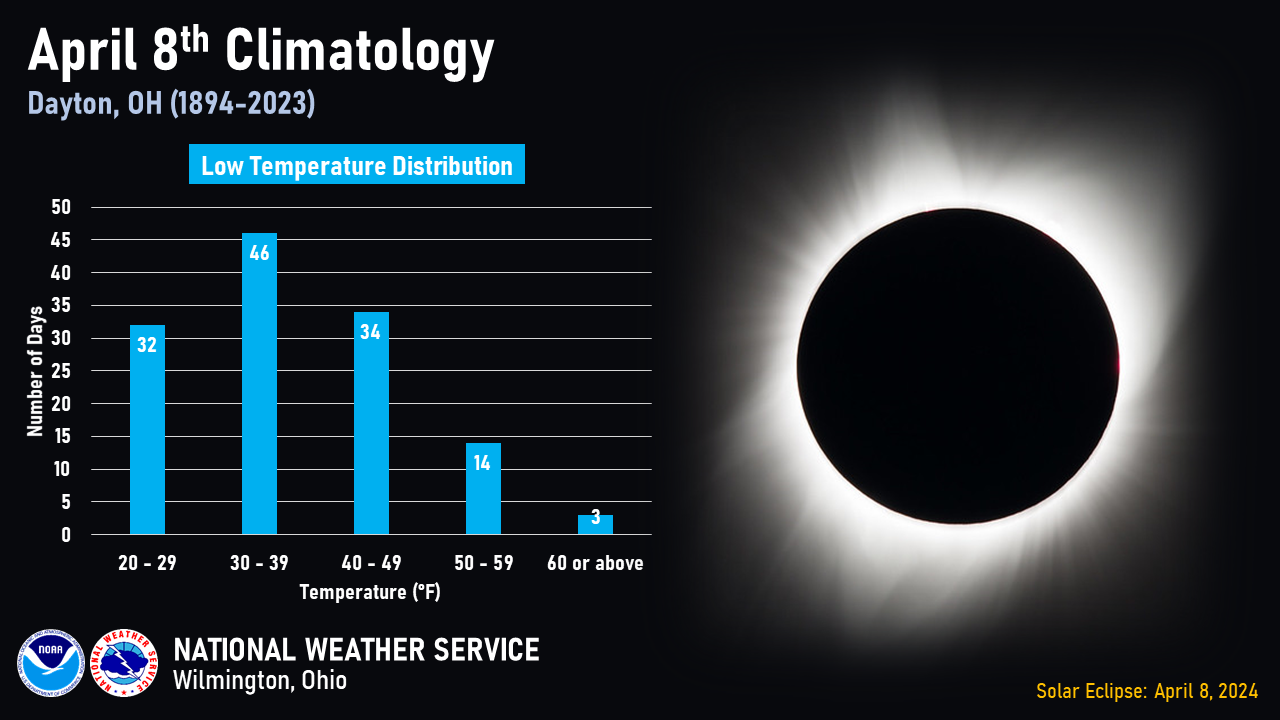
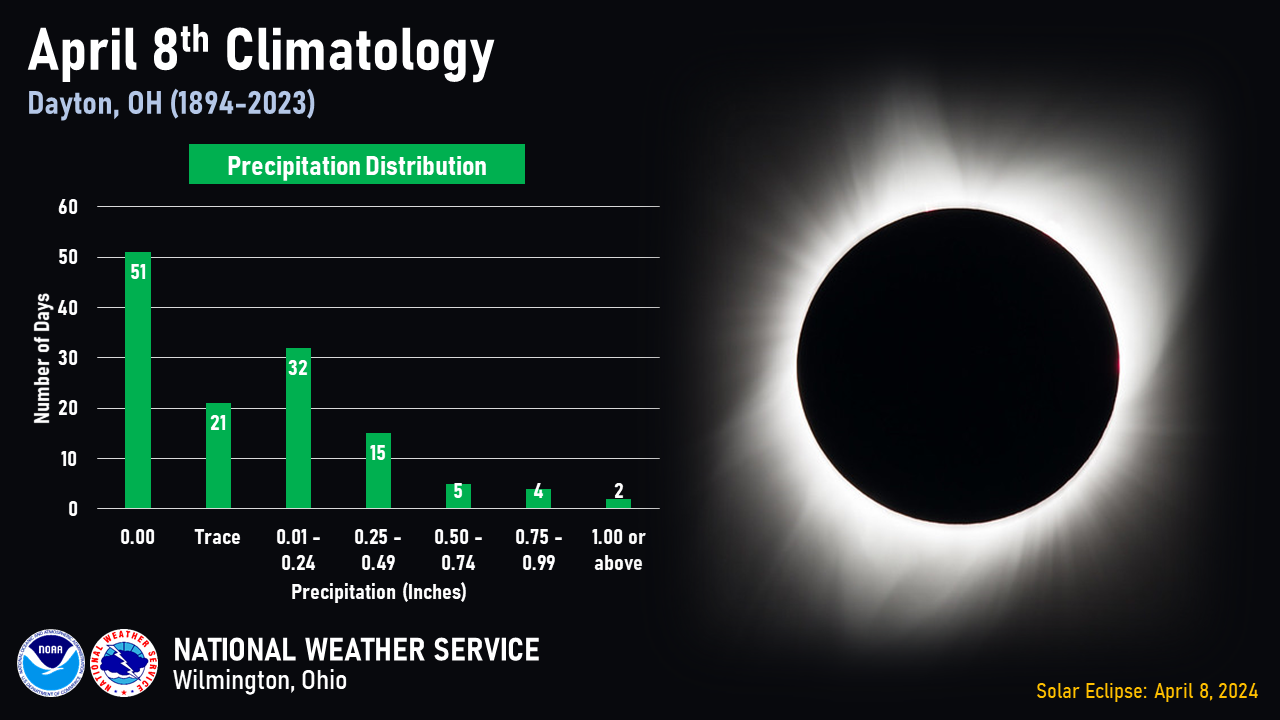
April 8th Climatology
Name
Period of Record
% Data Available
Average
Record High
Record Low
Precipitation (in)
1871-2023
100%
0.18
2.11 (1957)
0.00 (2023)+
Snowfall (in)
1893-2023
99%
0.1
4.2 (1909)
0.0 (2023)+
Maximum Temperature (F)
1873-2023
100%
60
80 (2021)
34 (1983)
Minimum Temperature (F)
1873-2023
100%
41
68 (1889)
20 (1983)

April 8th Climatology - Cincinnati, OH
YEAR
MAX
MIN
PRCP
SNOWFALL
SNOW DEPTH
1871
M M 0 M M
1872 M M 1.62 M M
1873 78 56 0 M M
1874 53 44 0 M M
1875 78 56 0 M M
1876 58 41 0 M M
1877 56 48 0.67 M M
1878 68 50 0.01 M M
1879 62 38 0 M M
1880 48 37 0 M M
1881 46 40 0.74 M M
1882 68 60 0.04 M M
1883 58 42 0 M M
1884 48 36 0.04 M M
1885 63 34 0.03 M M
1886 53 28 0 M M
1887 68 38 0 M M
1888 58 40 0 M M
1889 62 38 0 M M
1890 80 66 0.07 M M
1891 56 32 0 M M
1892 57 44 0.02 M M
1893 79 68 T 0 M
1894 52 34 T 0 M
1895 53 47 0.08 0 M
1896 49 31 0 0 M
1897 42 39 0.41 0 M
1898 59 34 0 0 M
1899 41 37 0.01 T M
1900 74 47 0 0 M
1901 49 40 0.01 0 M
1902 42 26 T 0 M
1903 65 47 1.02 0 M
1904 64 51 0.28 0 M
1905 58 29 T 0 M
1906 70 54 0.17 0 M
1907 51 37 T T M
1908 68 39 0.92 0 M
1909 55 35 0.01 0 M
1910 69 39 0 0 M
1911 46 37 0.08 0 M
1912 58 34 0 0 M
1913 53 32 0.22 0 M
1914 38 28 0.04 T M
1915 73 43 0 0 M
1916 34 30 0.51 4.2 2
1917 39 28 0.08 0.3 T
1918 50 33 0 0 0
1919 72 58 0.13 0 0
1920 50 32 0 0 0
1921 68 50 0.8 0 0
1922 80 61 T 0 0
1923 58 30 0.03 0 0
1924 67 34 0 0 0
1925 75 43 0 0 0
1926 55 37 1.54 0 0
1927 51 38 0.29 0 0
1928 46 32 0 T 0
1929 70 58 0.33 0 0
1930 56 33 0 0 0
1931 76 42 0 0 0
1932 60 44 0.33 0 0
1933 71 34 0 0 0
1934 68 44 0 0 0
1935 45 37 0.1 0 0
1936 47 23 0 0 0
1937 51 37 0.24 0 0
1938 64 38 0.76 0 0
1939 43 33 0.03 T 0
1940 57 42 0.21 0 0
1941 76 44 0 0 0
1942 47 39 0.66 0 0
1943 72 51 0 0 0
1944 67 53 0.16 0 0
1945 72 43 0 0 0
1946 65 48 0.36 0 0
1947 51 35 0.41 M M
1948 73 45 0 0 0
1949 53 39 T 0 0
1950 55 33 T 0 0
1951 55 42 0.02 0 0
1952 61 34 0 0 0
1953 58 38 T 0 0
1954 68 38 T 0 0
1955 59 26 0 0 0
1956 37 29 0.06 0.6 1
1957 48 30 0.85 0.1 0
1958 58 30 0 0 0
1959 78 64 0 0 0
1960 58 35 T 0 0
1961 54 32 0 0 0
1962 67 40 0.12 0 0
1963 68 39 0.06 0 0
1964 45 35 T T 0
1965 73 46 0.65 0 0
1966 47 31 0.13 0 0
1967 57 38 0 0 0
1968 70 56 T 0 0
1969 79 49 0 0 0
1970 76 37 0 0 0
1971 71 33 0 0 0
1972 34 20 T T 0
1973 53 40 0.15 0 0
1974 47 31 0.98 0.4 0
1975 53 34 0 0 0
1976 59 38 0 0 0
1977 52 33 0 0 0
1978 66 44 0 0 0
1979 58 37 0.19 0 0
1980 71 52 0.28 0 0
1981 73 49 T 0 0
1982 41 29 0.19 1.1 T
1983 48 41 0.62 0 0
1984 55 38 T 0 0
1985 47 29 T T 0
1986 66 44 0 0 0
1987 65 37 0 0 0
1988 60 39 0 0 0
1989 41 34 0.29 T 0
1990 59 24 0 0 0
1991 74 60 0.2 0 0
1992 68 45 0.07 0 0
1993 72 50 T 0 0
1994 63 32 0 0 0
1995 78 52 1.12 0 0
1996 46 30 T T 0
1997 57 25 0 0 0
1998 73 52 2.11 T 0
1999 77 56 T 0 0
2000 53 31 0.03 0 0
2001 80 68 0 0 0
2002 73 55 T 0 0
2003 46 37 0.03 0 0
2004 70 47 T 0 0
2005 67 46 0 0 0
2006 50 38 0 0 0
2007 38 28 T T 0
2008 74 51 0 0 0
2009 57 32 0 0 0
2010 64 39 0.42 0 0
2011 78 54 0.01 0 0
2012 65 43 T 0 0
2013 73 53 T 0 0
2014 60 43 0.02 T 0
2015 71 54 0.45 T 0
2016 44 28 0.14 T 0
2017 64 28 0 0 0
2018 44 25 0 T 0
2019 73 58 0.02 0 0
2020 80 56 0.49 0 0
2021 69 57 0.02 0 0
2022 49 35 0.06 0 0
2023 58 39 0 0 0
April 8th Climatology
Name
Period of Record
% Data Available
Average
Record High
Record Low
Precipitation (in)
1879-2023
100%
0.15
1.07 (1957)
0.00 (2023)+
Snowfall (in)
1885-2023
99%
0.0
2.0 (1909)
0.0 (2023)+
Maximum Temperature (F)
1879-2023
100%
58
83 (2021)
30 (1983)
Minimum Temperature (F)
1879-2023
100%
38
67 (1889)
19 (1983)
April 8th Climatology - Columbus, OH
YEAR
MAX
MIN
PRCP
SNOWFALL
SNOW DEPTH
1879 59 33 0 M M
1880 47 31 0 M M
1881 48 37 0 M M
1882 67 50 0 M M
1883 53 34 0 M M
1884 48 33 0.03 M M
1885 56 33 0.06 0 M
1886 47 23 0 0 M
1887 67 36 0 0 M
1888 50 30 0 0 M
1889 60 34 0 0 M
1890 75 56 0.04 0 M
1891 51 30 0 0 M
1892 51 43 0.06 0 M
1893 83 64 T 0 M
1894 50 30 T 0 M
1895 56 48 1.07 0 M
1896 48 28 0 0 M
1897 42 37 0.44 T M
1898 59 30 0 0 M
1899 41 35 0.1 T M
1900 65 39 0 0 M
1901 46 42 0.01 0 M
1902 39 24 0.14 0.2 M
1903 61 47 0.82 0 M
1904 62 49 0.28 0 M
1905 53 28 0 0 M
1906 66 50 0.11 0 M
1907 51 37 0.01 0 M
1908 66 39 0.57 0 M
1909 54 31 T 0 M
1910 65 34 0 0 M
1911 46 33 0.06 0 M
1912 54 31 0 0 M
1913 50 28 0 0 M
1914 35 25 0.1 0.4 M
1915 68 39 0 0 M
1916 36 30 0.56 2 M
1917 37 27 0.03 0 M
1918 51 33 0.01 0 M
1919 71 62 T 0 M
1920 44 26 0.01 0.1 M
1921 68 50 0.83 0 M
1922 77 59 0.37 0 M
1923 64 29 T T M
1924 61 33 T 0 M
1925 70 47 0 0 M
1926 56 33 0.74 0 M
1927 48 35 0.13 0 M
1928 39 30 0.01 0.1 M
1929 69 55 0.11 0 M
1930 50 31 0 0 M
1931 71 37 0 0 M
1932 59 46 0.34 0 M
1933 61 34 0 0 M
1934 67 45 0 0 M
1935 43 37 0.54 0 M
1936 46 24 0 0 M
1937 49 39 0.25 0 M
1938 63 38 1.03 0 M
1939 40 31 0.01 T M
1940 59 44 0.27 0 M
1941 73 44 0 0 M
1942 49 36 0.05 0 M
1943 68 42 0 0 M
1944 62 50 0.03 0 M
1945 70 41 0 0 M
1946 59 45 0.08 0 M
1947 55 34 0.16 0 M
1948 74 46 0.17 0 0
1949 50 32 0.15 T 0
1950 46 26 T 0 0
1951 57 44 0.34 0 0
1952 50 29 0 0 0
1953 61 34 0 0 0
1954 72 35 0.25 T 0
1955 61 27 0 0 0
1956 40 31 T 0.1 T
1957 39 30 0.65 0.8 1
1958 58 29 0 0 0
1959 74 55 0 0 0
1960 51 32 0.03 0 0
1961 49 28 0 0 0
1962 64 32 T 0 0
1963 51 35 T 0 0
1964 48 35 T T 0
1965 72 44 0.97 0 0
1966 44 25 0.13 0.2 0
1967 55 32 0 0 0
1968 70 54 0 0 0
1969 78 38 0 0 0
1970 72 32 0 0 0
1971 69 29 0 0 0
1972 30 19 T T T
1973 52 42 0.33 0 0
1974 49 32 0.6 0.3 0
1975 51 24 0 0 0
1976 48 30 0 0 0
1977 43 28 0 0 0
1978 59 38 0 0 0
1979 63 33 0.17 0 0
1980 66 48 0.36 0 0
1981 76 53 T 0 0
1982 43 20 0.02 0.4 0
1983 48 40 0.65 0 0
1984 57 29 T 0 0
1985 45 30 0.08 0.8 0
1986 64 40 0.09 0 0
1987 60 34 0 0 0
1988 54 36 0 0 0
1989 41 34 0.17 0 0
1990 56 22 0 0 0
1991 75 64 0.36 0 0
1992 66 41 0 0 0
1993 75 44 T 0 0
1994 62 25 0 0 0
1995 71 49 0.06 0 0
1996 45 28 T T 0
1997 54 23 T T 0
1998 74 51 0.79 T 0
1999 79 49 0.06 0 0
2000 54 33 0.24 0 0
2001 83 67 0 0 0
2002 71 48 0.08 0 0
2003 48 37 T 0 0
2004 70 45 0.08 0 0
2005 66 43 0 0 0
2006 47 33 0 0 0
2007 37 26 T T T
2008 78 48 0 0 0
2009 53 34 0 0 0
2010 68 41 0.09 0 0
2011 61 51 0.01 0 0
2012 64 47 0.02 0 0
2013 73 53 T 0 0
2014 62 44 0.02 0 0
2015 67 54 0.56 0 0
2016 41 30 0.18 T 0
2017 61 32 0 0 0
2018 43 25 0 0 0
2019 71 57 0 0 0
2020 74 53 0.6 0 0
2021 78 59 0.26 0 0
2022 51 35 T 0 0
2023 58 33 0 0 0
April 8th Climatology
Name
Period of Record
% Data Available
Average
Record High
Record Low
Precipitation (in)
1894-2023
100%
0.15
1.31 (1957)
0.00 (2023)+
Snowfall (in)
1894-2023
99%
0.0
4.7 (1909)
0.0 (2023)+
Maximum Temperature (F)
1894-2023
100%
57
83 (2021)
31 (1983)
Minimum Temperature (F)
1894-2023
100%
37
66 (1889)
15 (1983)
April 8th Climatology - Dayton, OH
YEAR
MAX
MIN
PRCP
SNOWFALL
SNOW DEPTH
1894 52 30 0.00 M M
1895 59 47 0.21 0.0 M
1896 47 27 0.00 0.0 0.0
1897 41 33 0.52 M M
1898 60 25 0.00 0.0 M
1899 44 35 0.02 0.0 M
1900 71 45 0.00 M M
1901 48 40 0.00 0.0 M
1902 44 26 0.03 M M
1903 64 47 0.36 M M
1904 62 34 0.15 0.0 M
1905 56 24 T T M
1906 67 41 0.00 M M
1907 51 40 0.21 0.0 M
1908 69 55 0.48 0.0 M
1909 52 40 0.00 0.0 M
1910 57 28 0.00 M M
1911 50 32 0.00 0.0 M
1912 57 32 0.00 0.0 M
1913 48 28 0.00 0.0 M
1914 36 25 0.01 T M
1915 72 42 0.00 0.0 M
1916 34 29 0.29 2.0 M
1917 36 26 0.05 0.5 M
1918 49 30 0.00 0.0 M
1919 72 60 0.00 0.0 M
1920 46 29 T T M
1921 66 48 0.95 0.0 M
1922 76 58 0.54 0.0 M
1923 57 29 0.01 T M
1924 64 33 0.00 0.0 M
1925 73 39 0.00 0.0 M
1926 52 36 0.57 0.0 M
1927 49 38 0.30 0.0 M
1928 41 30 0.01 0.1 M
1929 69 59 0.36 0.0 M
1930 53 32 0.00 0.0 M
1931 75 44 0.00 0.0 M
1932 60 44 0.26 0.0 M
1933 64 33 0.00 0.0 M
1934 66 38 0.00 0.0 0.0
1935 42 40 0.39 0.0 M
1936 46 24 0.00 0.0 M
1937 47 37 0.33 0.0 M
1938 60 36 0.63 0.0 M
1939 42 32 0.01 T M
1940 56 40 0.25 0.0 M
1941 70 42 0.00 0.0 M
1942 45 36 0.36 0.0 M
1943 69 40 0.00 0.0 0.0
1944 64 51 0.35 0.0 0.0
1945 71 41 0.00 0.0 0.0
1946 64 46 0.00 0.0 0.0
1947 53 33 0.10 0.0 0.0
1948 69 42 T 0.0 0.0
1949 50 37 T T 0.0
1950 49 28 T 0.0 0.0
1951 55 42 0.08 0.0 0.0
1952 55 31 0.00 0.0 0.0
1953 60 35 T 0.0 0.0
1954 64 35 0.04 0.0 0.0
1955 59 26 0.00 0.0 0.0
1956 36 28 0.01 T T
1957 38 28 0.91 0.3 0.0
1958 57 32 0.00 0.0 0.0
1959 66 50 0.08 0.0 0.0
1960 51 32 0.04 T 0.0
1961 49 27 0.00 0.0 0.0
1962 66 34 T 0.0 0.0
1963 61 40 0.17 0.0 0.0
1964 43 34 T T 0.0
1965 70 47 0.68 0.0 0.0
1966 45 29 0.10 T 0.0
1967 54 33 T 0.0 0.0
1968 70 49 T 0.0 0.0
1969 76 47 0.00 0.0 0.0
1970 73 40 0.00 0.0 0.0
1971 72 34 0.00 0.0 0.0
1972 31 15 T T T
1973 53 38 0.06 0.0 0.0
1974 46 28 0.87 4.7 0.0
1975 54 26 0.00 0.0 0.0
1976 51 28 0.00 0.0 0.0
1977 43 29 0.00 0.0 0.0
1978 63 41 0.00 0.0 0.0
1979 62 33 0.27 0.0 0.0
1980 69 49 0.16 0.0 0.0
1981 75 54 T 0.0 0.0
1982 39 23 0.06 0.8 0.0
1983 46 38 0.42 0.0 0.0
1984 52 33 T 0.0 0.0
1985 45 28 0.04 0.4 0.0
1986 64 41 T 0.0 0.0
1987 60 36 0.00 0.0 0.0
1988 56 35 0.00 0.0 0.0
1989 41 35 0.26 T 0.0
1990 57 25 0.00 0.0 0.0
1991 73 61 0.16 0.0 0.0
1992 68 37 0.00 0.0 0.0
1993 70 49 T 0.0 0.0
1994 60 28 0.00 0.0 0.0
1995 71 51 0.02 0.0 0.0
1996 45 26 0.00 0.0 0.0
1997 51 20 0.00 0.0 0.0
1998 73 50 0.46 0.0 0.0
1999 77 51 T 0.0 0.0
2000 53 31 0.10 0.0 0.0
2001 83 66 T 0.0 0.0
2002 69 50 0.05 0.0 0.0
2003 42 33 T 0.0 0.0
2004 65 47 0.08 0.0 0.0
2005 63 39 0.00 0.0 0.0
2006 46 32 0.00 0.0 0.0
2007 36 25 T T 0.0
2008 75 43 0.00 0.0 0.0
2009 53 31 0.00 0.0 0.0
2010 59 37 0.75 0.0 0.0
2011 65 47 0.04 0.0 0.0
2012 63 46 T 0.0 0.0
2013 72 54 0.00 0.0 0.0
2014 61 42 0.03 0.0 0.0
2015 71 49 1.22 0.0 0.0
2016 41 27 0.13 0.1 0.0
2017 61 29 0.00 0.0 0.0
2018 40 21 0.00 0.0 0.0
2019 72 56 T 0.0 0.0
2020 76 56 1.31 T 0.0
2021 71 59 0.19 0.0 0.0
2022 49 37 0.03 0.0 0.0
2023 58 35 0.00 0.0 0.0


 Follow us on YouTube